Products & Services

*** YOUR MAP TO PERSONALIZED HEALTH CARE *** 

Home
The Company
Mission
It's About You
Products & Services
Testimonials
Reference Material
Become a Distributor
Contact Information
Terms of Use Agreement

In addition to the KAMM-12, described below, we will soon make available a Health Status Assessment report, called the Metabolic Health Map (MHM) and a Health Monitoring report.

The KAMM-12--what it is and what it does:

The Kvitash Advanced Metabolic Map (KAMM) is the first reporting product provided by Personal Health Response.  Since twelve parameters from a standard blood chemistry are used, the report is called the KAMM-12.

KAMM-12 (KVITASHTM Advanced Metabolic M@p-12) is a practical application of a new generation of Information Technology with unique Perceptual & Cognitive capabilities for evaluation of metabolic processes constantly going on in the human body. This technology allows dramatic increases in the human potential for perception of the complexity of multiple imbalances in any natural or human made system (U.S. Patent No. 4,527,240) and effectively communicates results in a clear, understandable and precisely measurable ways.

KAMM-12 evaluates simultaneously whole quantitative, qualitative, relational, and directional aspects of biochemical processes going on in the human body in a truly integrated multi-dimensional way.

KAMM-12 identifies six novel types of metabolic dysfunctions.

KAMM-12 detects 396 simple imbalances and many more complex dysblances among human biochemical processes.

KAMM-12 transforms numerical information into patterns of metabolic networks.

KAMM-12 reveals how well numerous biochemical processes are organized and coordinated.

KAMM-12 shows how different biochemical processes function together as a team rather than a group of single players.

KAMM-12 provides a new class of information which is not available from any existing modalities.

Currently in standard laboratory reports the biochemical status of a person is represented as a list of single isolated numbers reflecting levels of different variables, such as Cholesterol, Calcium, Glucose, Protein, etc. As long as these variables are presented separately, it is impossible to know how each of them relates to one another. Also, it is impossible to quantitatively assess what is lacking or how well the biochemical processes are coordinated. There is no way to know how these processes are dynamically organized into a completely integrated and inseparable total whole. Now all of the above limitations are completely overcome by KAMM-12.


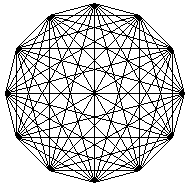
Ideal
In-Balance
Out-of-Balance

The Left Graph represents completely balanced basic biochemical processes as a network of 12 different variables relating to each other in total harmony. This Ideal Pattern serves as a good reference to compare and contrast with your personal data and to see how close you are to or how far you are from a possible optimal state of health.

The Middle Graph  represents which of biochemical processes are still functioning effectively in a well organized way. KAMM-12 immediately allows you to see which variable and how many of them are in perfect balance with each other. KAMM-12 shows which biochemical processes are maintaining good coordination among themselves.

The Right Graph represents which of your biochemical processes are involved in single simple biochemical imbalances as well as how many of them are participating in networks of multiple complex biochemical dysbalances. It indicates how metabolic distress has disrupted physiological coordination, detects in which way healthy structures are fragmented, and shows the degree of metabolic dysfunctions.

 
Follow your interest:
Copyright © 1996-2007 Personal Health Response
All Rights Reserved. Last modified: 11/15/12